Showing posts with label Lan Denominator. Show all posts

Thursday, May 5, 2011

Ch 7 How to make a Budget

Step 1 - Choose a career
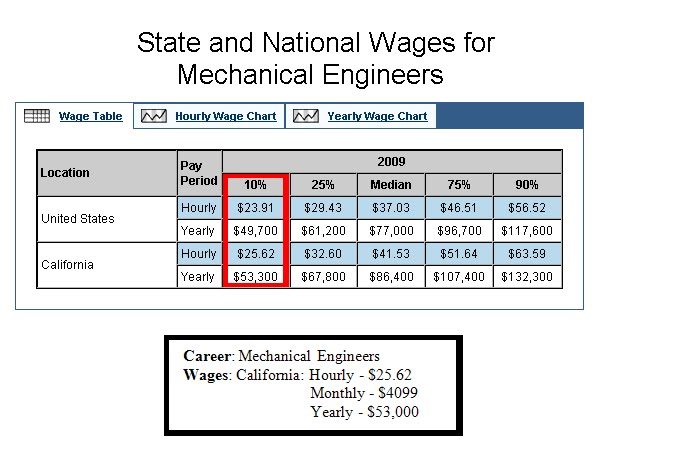
In this project, I chose mechanical engineering as my career.


Step 2 - Choose a college and pay for it.
I planned to go to UC Davis.
The tuition for all 4 years is $109,845
To pay for it, I have:
  • Parent's savings - $20,000
  • Scholarships total - $42,500
  • Financial Aids total - $22,000
All together = $84,500

Step 3 - Student Loan Payment
Since i have $84,500 , I'll have to borrow $25,345 from direct loans and according to the Student loan payment calculator, I'll have to pay them back $292 a month for 10 years.


Step 4 - Finding a Job

I found a job at the Taj Campton Place Hotel in San Francisco as an engineer that fixes machines and such in the hotel.
The salary is $28.13 / hr
so each month I'll be getting $4501 a month
and $54,010 a year.
This job includes Health Benefits that covers for Health, Dental, and Vision for $127 a month.
They also have the 401k retirement plan which takes 7% of my salary so my monthly income is $4058.93


Step 5 - Find a place to live.
I found an apartment near Lake Merritt for $1,050/Month
They only cover Garbage and Water bills.
They have a coin operated laundry and included a gas stove and a dish washer.


Step 6 - Transportation
It's really easy to take the Bart to my work place from my apartment.
I have to walk about 5 minutes to the Lake Merritt Bart station and take the Bart to work for $3.10 a ride so it's about $6.20 a day and around $124 a month.


My Budget
Overall after all the expenses of a month, I'll be left with $711 a month.

Thursday, March 31, 2011

Ch.6 Project : Curve Fitting with Polynomial Models


For my Ch.6 Project, I picked Dell Inc as my stock. First i went to Yahoo Finance and find the historical prices for my stock for the years (1994, 1995, 1996, 1997, 2000, 2001, 2003, 2004). Next, i put the data into my graphing calculator and find the equation. to know which equation best fits the data, you have to try them and see who's R^2 is closer to one and apparently mine was a Quartic Regression. Then i use that polynomial equation to find the values for the year (2002, 2005, 2008, 2010, 2011). and then went back to Yahoo finance and find the actual prices for those years and compared them. Many of my predictions did not match and this is where the researches comes in to tell me why. Lastly, i have to redo all of those steps to find the same things for the index which is NASDAQ.

Thursday, December 9, 2010

3-D Graph


For my #D graph project. Our main equation was x+4y+2z=4. For me, i have to change the equation so it's (X,Y,-Z) so it'll end up x+4y-2z=4.
I find the X,Y.and Z intercepts and they were (4,0,0), (0,1,0), and (0,0,-2). I graph them on the #D coordinate graph and then i connected them and made a 3D plane with the yarns in blue.

Monday, December 6, 2010

Ch.3.4 Linear Programing Project


For my chapter4 Linear Programing project. George wants to buy tiles that will cover up to 800 square feet of his kitchen floor. He wants to buy two different colored tiles: Black and White tiles. Each black tile will cover 2 square feet. Each white tile will cover 4 square feet. Each tile costs $4.00 and he can only spend $1,000.
The variable X represents the number of black tiles and the variable Y represents the number of white tiles. From that word problem i can come up with 4 equations.

1) X is greater than or equal to zero.
2) Y is greater than or equal to zero.
3) 2x + 4y is less than or equal to 800 which will be Y is less than or equal to -1/2x + 200" when simplified.
4)4x + 4y is less than or equal to 1000 which will be "Y is less than or equal to -1x + 250" when simplified.


Each graph is shaded individually. The first equation is represented by the graph with orange shading, the second equation is represented by the graph with green shading, the third equation is represented by the graph with blue shading, and the last equation is represented by the graph with yellow shading. The last graph is shows the feasible region which is the space where all 4 graph's shading meet at.

Sunday, October 31, 2010

Ch.2 Project


For my Chapter 2 project, i picked Toyota Highlanders as my car. The speed in miles per hour is (55, 60, 65, 70, 75, 80), and the mileage in miles per gallon is (23, 22.3, 21.2, 19.1, 17.7, 16.6).
I used the data to make a scatter plot graph and it came out to be a Negative Correlation. Then I sketched the Line of Best Fit and used 2 points that lies on the line to find the Slope. The two points that i used are (60, 22.3) and (75, 17.7) and the slope came out to be -4.6/15. Next i used the Point-Slope form to find the equation that models the data and the equation is Y= -4.6/15X + 40.7. Next comes the work of a graphing calculator. I used the graphing calculator to find the Correlation Coefficient of R which is R= -0.99. The correlation coefficient tells us that the faster you drive, the mileage will be lower. The equation i found using the graphing calculator for the line of best fit is Y= -0.27X + 38.45. I Predicted that the mileage for a speed of 55 miles per hour is 23 miles per gallon. Lastly. I predicted the speed if the mileage is 28 miles per gallon would be 41.41 miles per hour.